Seek for help when debugging TVM

Hi all, I’m excited that I can debug tvm source code now! But when I dive into the source code, I can’t see very helpfull messages. Could you give some experience?

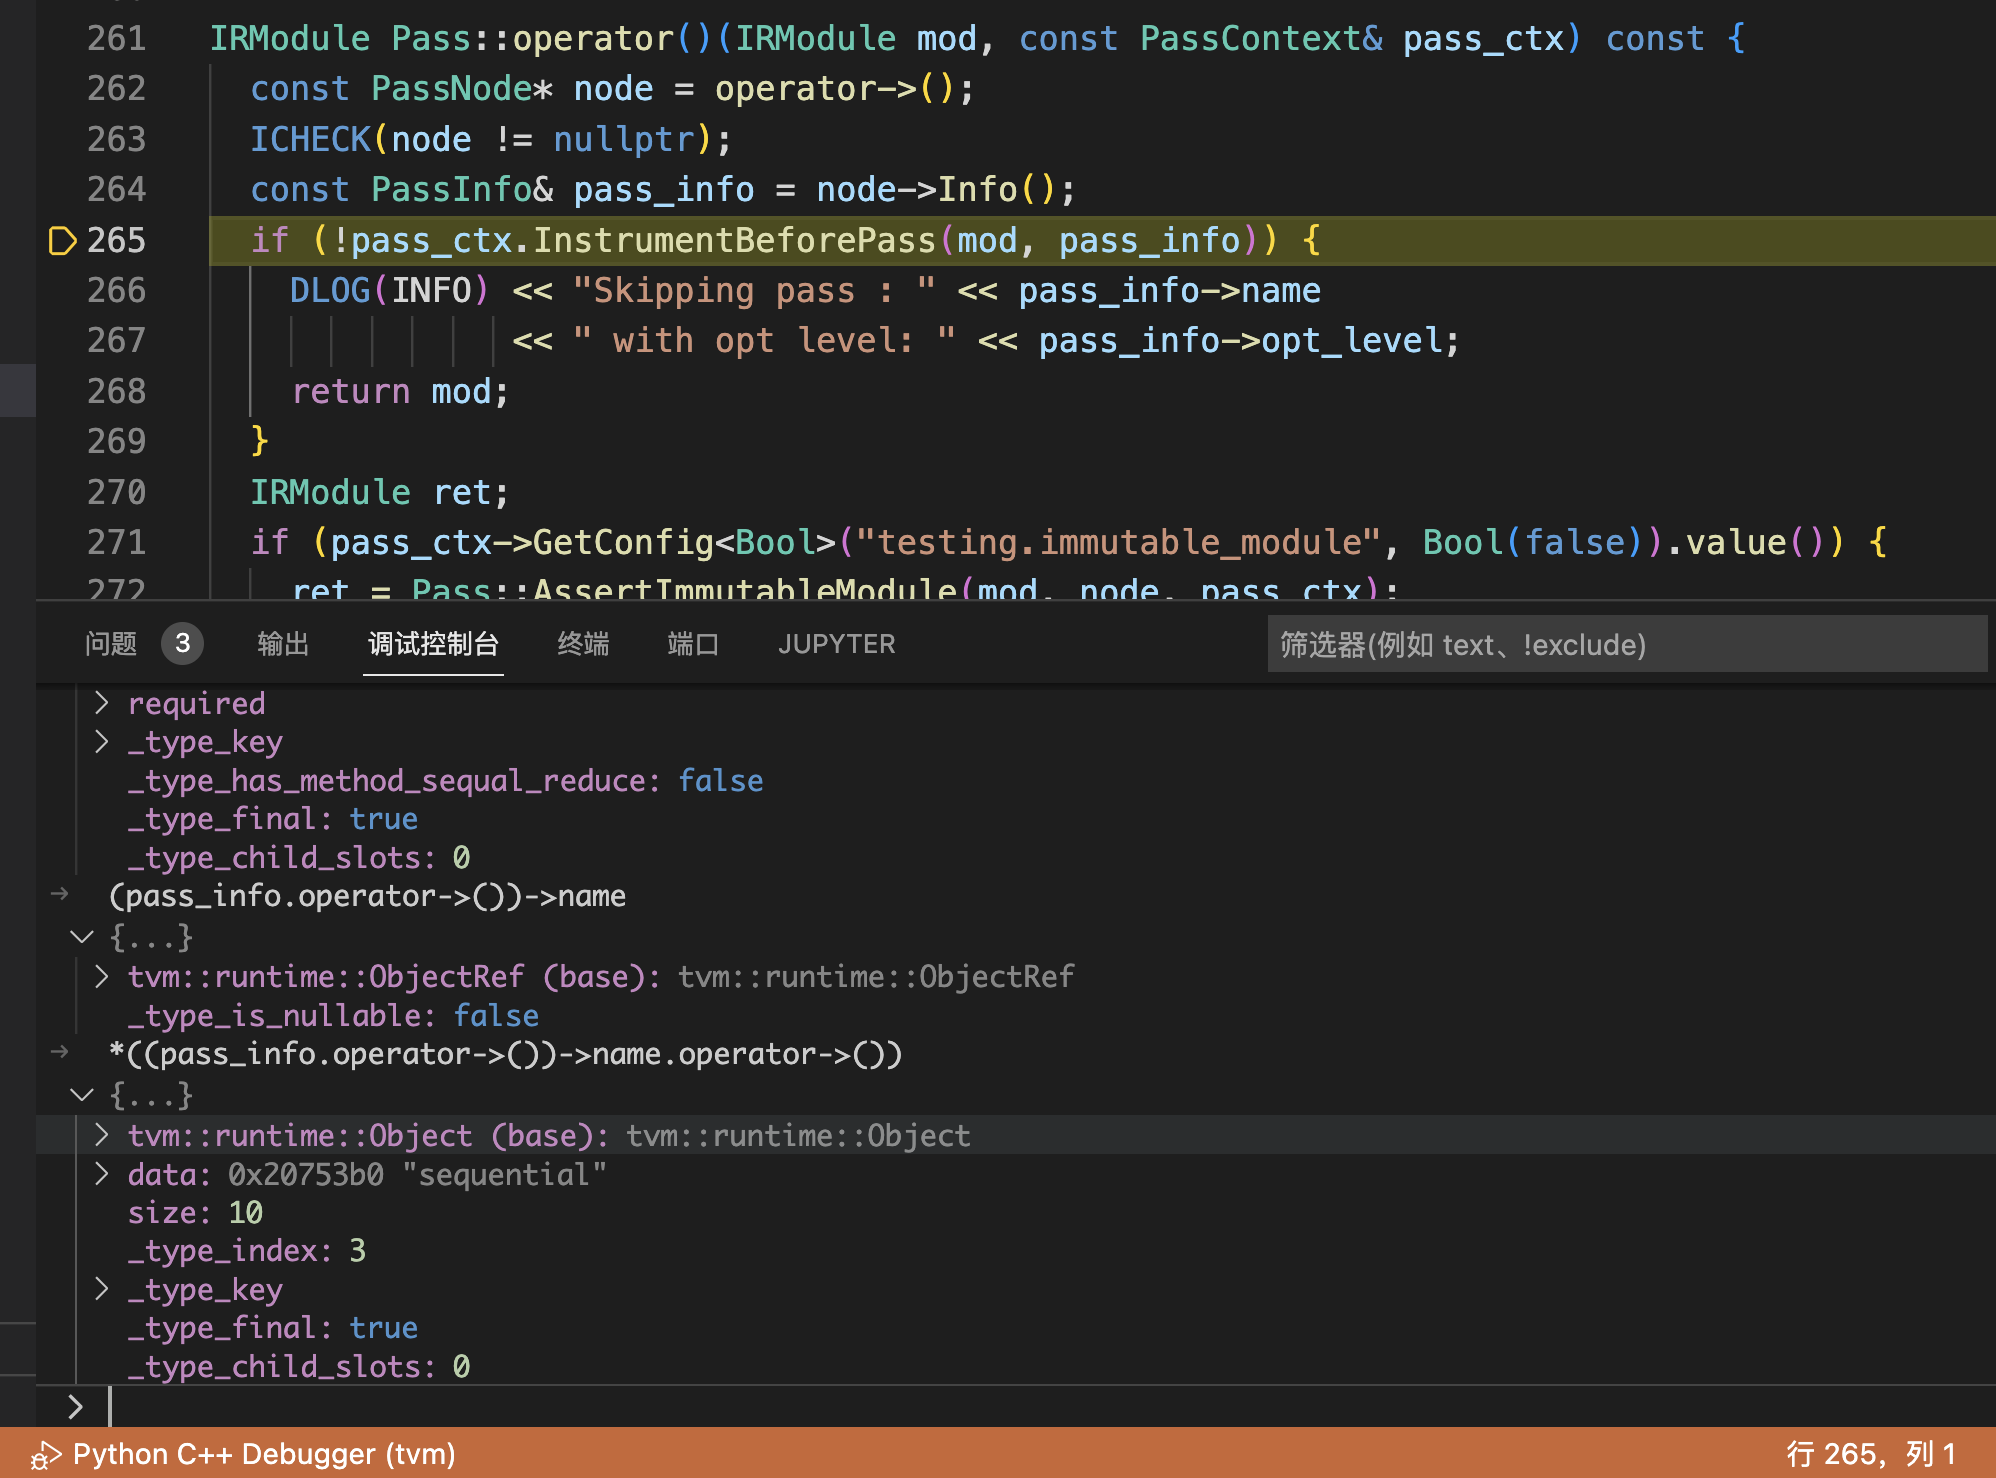
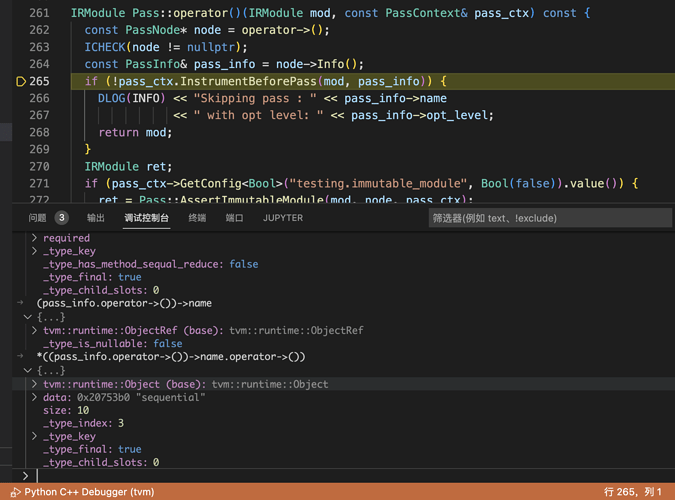
For example, it’s hard for me to see what contains in the variable mod. I use *mod.operator->() to print an IRModule, is that the best way?

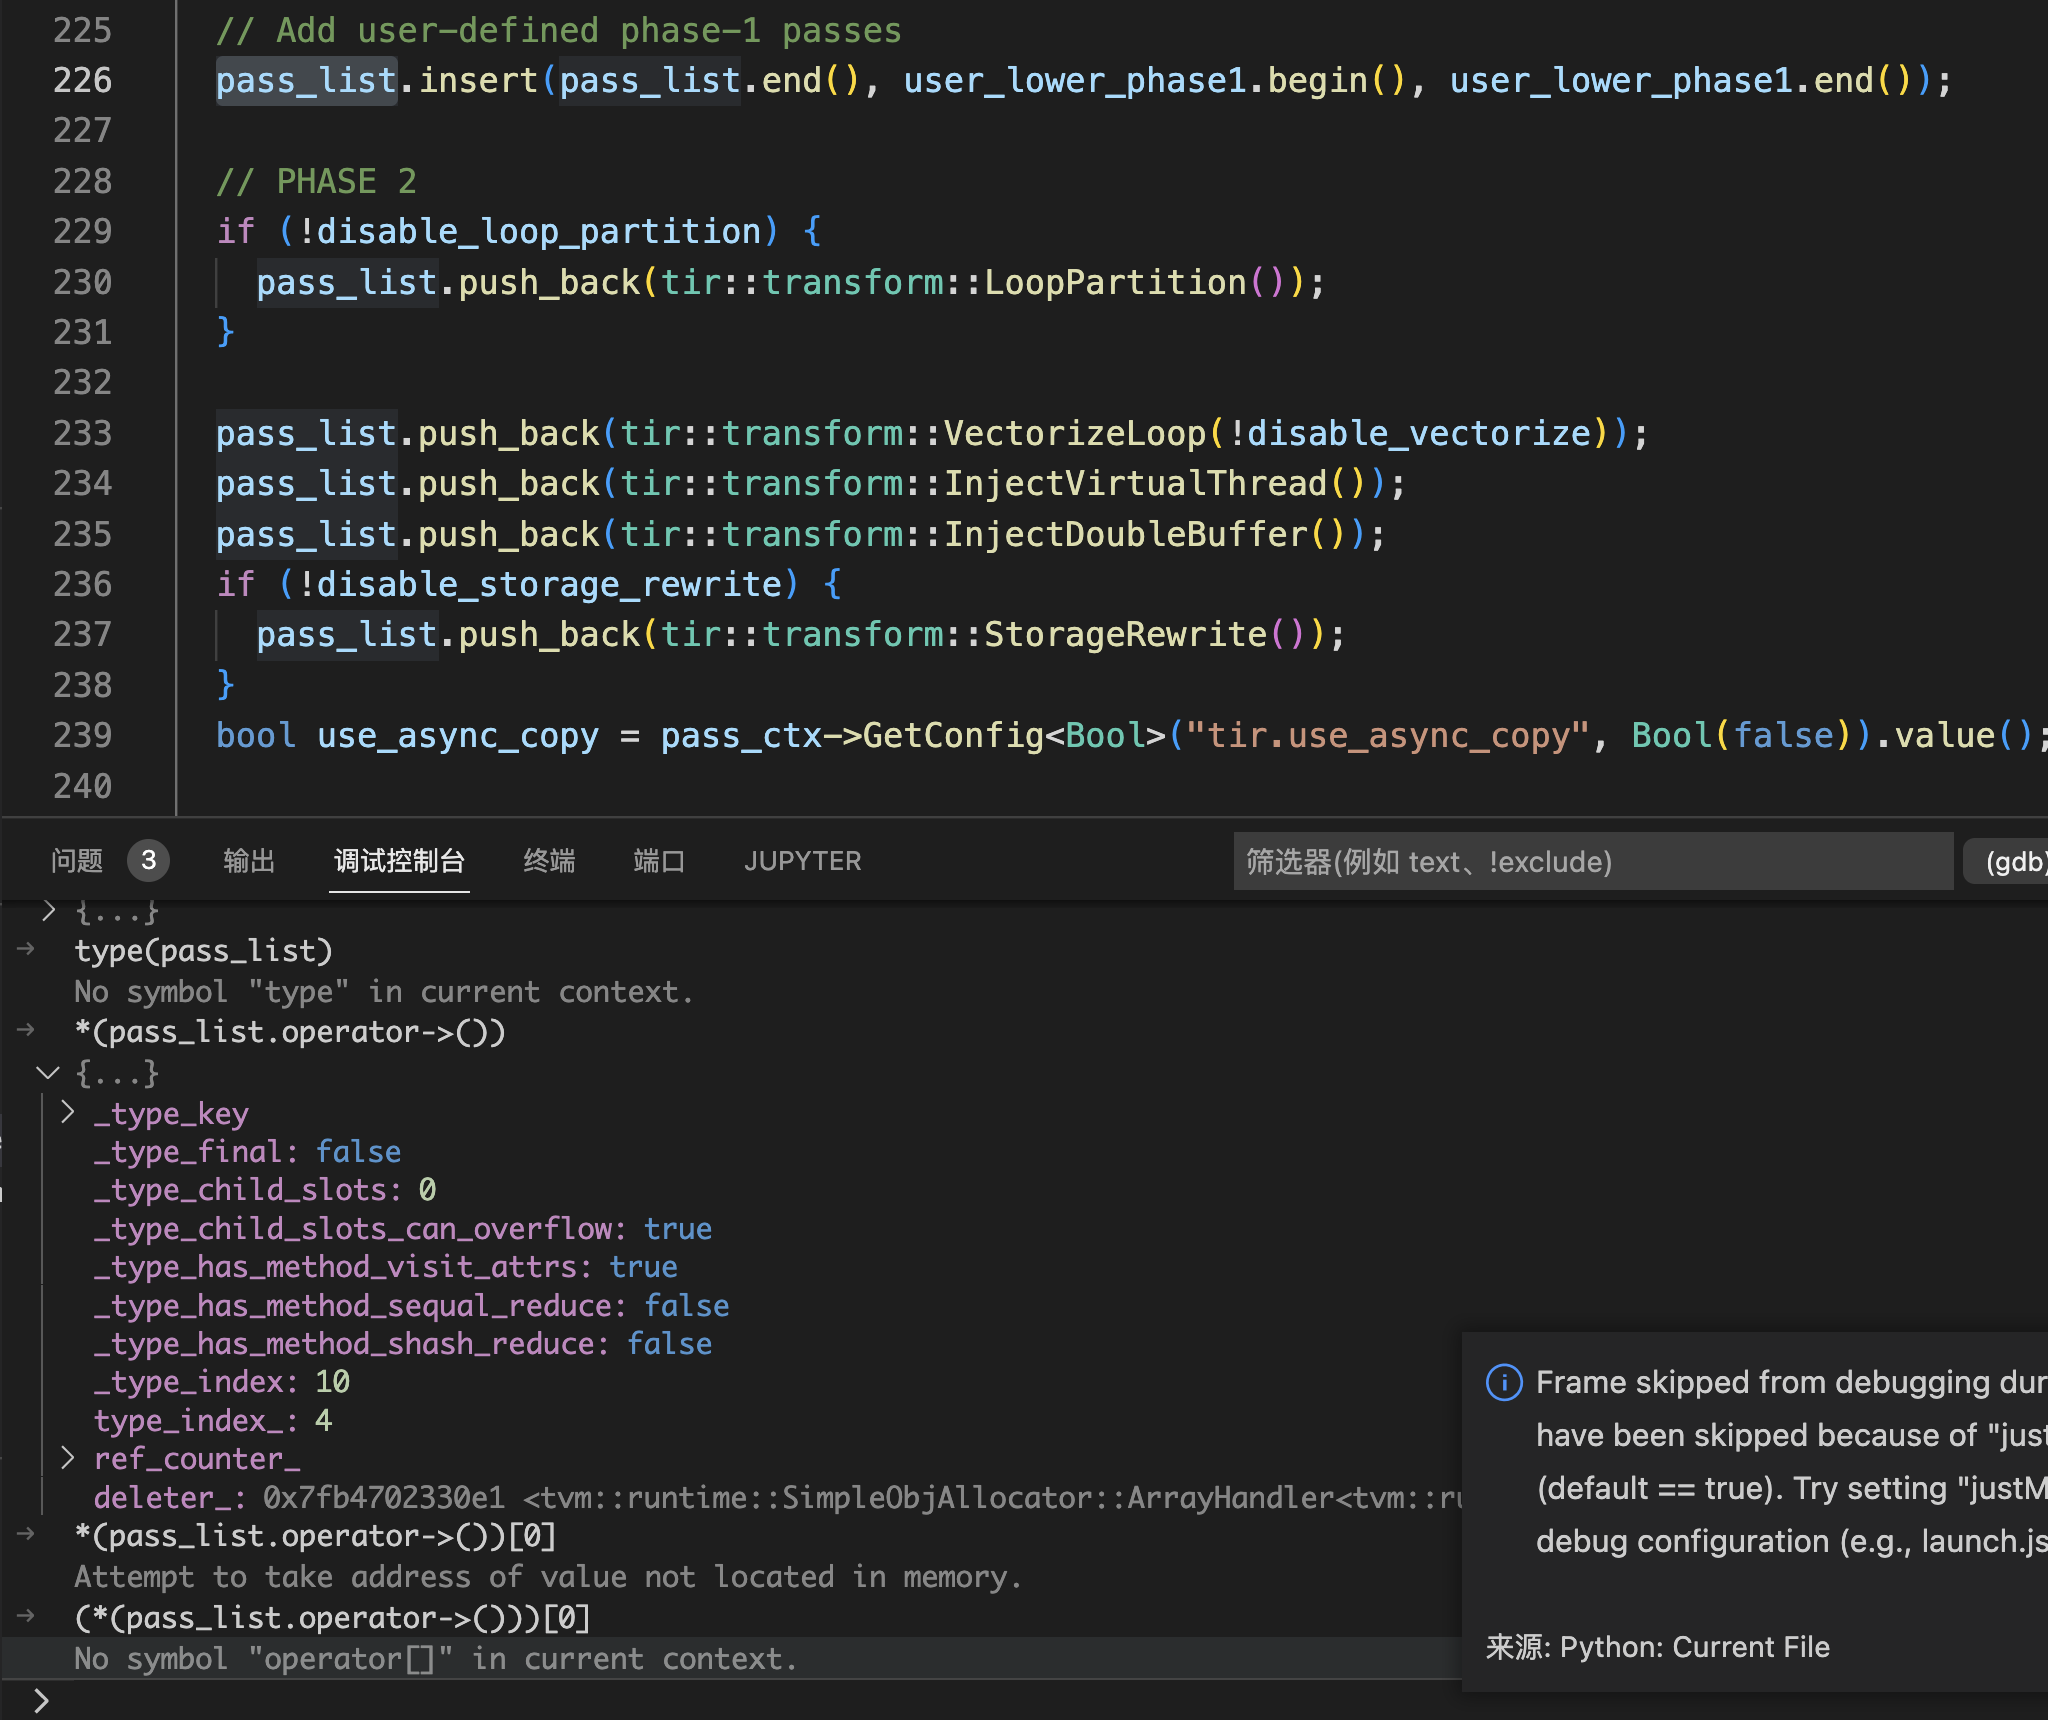
It prints a lot of infomation, but it’s hard to read. Could anyone who debug with tvm give some advice?

Any commands to see the class members? or somewhat, than you!

Another question, if I want to see the value of pass_list, how can I print it’s members?

You can print any TVM Object with tvm::Dump(...) call. For example in your above case, you can print the IRModule with tvm::Dump(mod), which would print the entire IRModule in text format.

There are also a couple of GDB extensions that might help while debugging.

Full Disclosure: I built the second one because I needed an easy way to explore the AST in GDB similar to what’s possible in python.

1 Like

Assuming you’re mentioning the pass_list defined in src/driver/driver_api.cc based on the piece of code shared, It’s defined using tvm::runtime::Array as Array<tvm::transform::Pass> pass_list, so you should be able to print that as well using tvm::Dump(pass_list)

Thank you ! It works!!! than you so much !

1 Like

I read you repo, it’s great! As I’m new to tvm and haven’t dive into that deep, I’ll try it later!

1 Like

@freshbird2023 Hi,could you please share how to debug tvm source code in VScode? Thanks a lot

hello, you can use vscode to read codes, and use gdb + pdb to debug codes.

You just used the pdb+pdb to run from python API to lower c++ realizeation, not other VScode extensions ? as this image show?

I didn’t use extensions, I tried some plugins, but they don’t work well. I think the pdb + gdb is ok for me. But I’m just a new bird, maybe there are some other good ways.

1 Like