Pass Instrument Framework Proposal

[IR][Pass][Instrument] Pass Instrument Framework

Proposal

Currently in TVM, there are trace mechanisms and passes time profiling.

  • Trace

/*!
 * \brief PassContextNode contains the information that a pass can rely on,
 * such as analysis results.
 * \sa PassContext
 */
class PassContextNode : public Object {
 public:
  // Skipped

  /*! \brief Trace function to be invoked before and after each pass. */
  TraceFunc trace_func;

  // Skipped
  • Pass Time Profiling

They have similar semantics that want to profile/trace passes.

This PR tries to generalize and integrate the concepts:

1. Trace is rename to PassInstrumentors with more functionalities:

  • Explicitly split RunBeforePass and RunAfterPass into different functions instead of checking in trace call back funcion.
    def trace(ir_module, pass_info, is_before):
       if is_before:
           # Before Pass Run
       else:
           # After Pass Run
          
    # ==>
    
    pi = tvm.instrument.PassInstrument()
    
    @pi.register_run_before_pass
    def run_before_pass(ir_module, pass_info):
        # Before Pass Run
    
    @pi.regiser_run_after_pass
    def run_after_pass(ir_module, pass_info):
        # After Pass Run
       
    @pi.register_set_up
    def set_up():
        # Instrumentation environment set up
    
    @pi.register_tear_down
    def tear_down():
        # Instrumentation environment clean up
    
  • PassInstrumentor collects a set of PassInstrument instead of single call back
    with tvm.transform.PassContext(Trace=_trace):
        # Call _trace in build flow
    
    # ==>  
    
    pi1 = tvm.instrument.PassInstrument()
    pi2 = tmv.instrument.PassInstrument()
    with tvm.transofm.PassContext(
         pass_instrumentor=tvm.instrument.PassInstrumentor([pi1, pi2]):
       # Call pi1 and pi2's callbacks in build flow
    

2. Provide a PassesTimeInstrument that leverages previous passes time profiling c++ code.

 TVM_REGISTER_GLOBAL("instrument.MakePassesTimeInstrument").set_body_typed([]() {
  auto pi = PassInstrument("PassesTimeInstrument");
  // No set up function for this time instrumentation.
  pi->RegisterTearDownCallback([]() { PassProfileThreadLocalStore::Get()->root.children.clear(); });
  pi->RegisterRunBeforePassCallback([](const IRModule&, const transform::PassInfo& pass_info) {
    PassProfile::EnterPass(pass_info->name);
    return true;
  });

  pi->RegisterRunAfterPassCallback(
      [](const IRModule&, const transform::PassInfo&) { PassProfile::ExitPass(); });

  return pi;
});

3. Inspired by LLVM and MLIR, it might be good to let run_before_pass() determines whether to run a pass with some instrumentation logics. (Return true to run pass; return false to skip pass)

/*!
 * \file tvm/ir/instrument.h
 *
 * This file implements a pass instrument infrastructure, inspired from LLVM and MLIR.
 * It inserts instrumentation points between passes run.
 *
 * Within a pass context (tvm::transfom::PassContext), the instrumentation call sequence will like:
 *
 *   Instrument SetUp
 *
 *     if (Instrument Before Pass)
 *       Pass Run
 *       Instrument After Pass
 *
 *     if (Instrument Before Pass)
 *       Pass Run
 *       Instrument After Pass
 *
 *   Instrument TearDown
 *
 *
 * Instrument point before pass can determine particular pass is disable or not depends on the
 * callback registered.
 */

Some Question Received

Thanks to [tkonolige] and [tqchen]

Q.

[tkonolige]

In order to avoid duplicating code it might be worth unifying this with the runtime profiling framework. I have a branch (which I haven’t submitted yet) that allows users to extend which kinds of information are collected.

[tqchen]

I agree it is important to have pass instrumentations, would be good to know how can it interact with Trace, since some of the callbacks might be similar and we need to unify the interface. On the design side, I think the runtime profiling and pass instrumentation might be different enough that might worth two separate solutions(perhaps a bit of reuse of timer if needed) As the former have more complexity wrt to GPU timer etc, while the later allows more statistics to be collected

A.

I would like to separate runtime profiling and pass instrumentation, too. This PR only focuses on pass profiling mechanisms like the passes time profiling, wants to make it easier to add more passes profiling implementations.

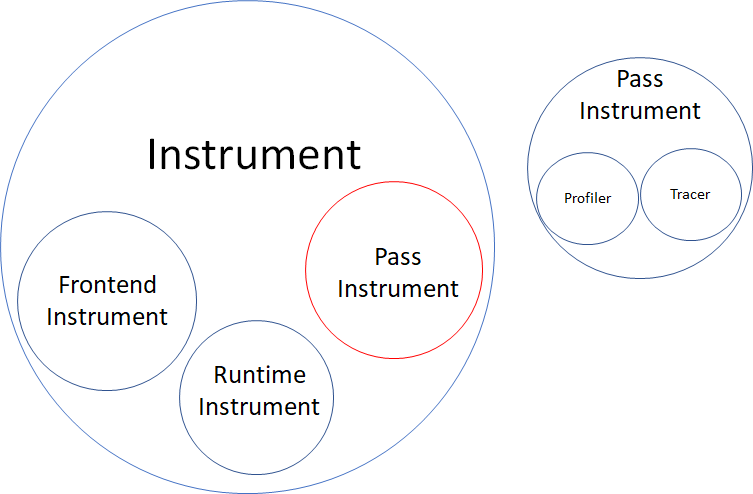
You might notice that this PR introduces a new namespace tvm.intrument. It intends to cover all instrument related (not limited to pass, but this PR only shows pass instrument), instead of mixing instrumentation/profiling code with transformation codes in tvm.transform. RuntimeProfiling could be add to this namespace, eg: tvm.instrument.Runtime.Profiling.

Please let me know how you think about this proposal :slight_smile:

@tqchen @tkonolige Here is the RFC created for discussion.

Also CC @zhiics @zxybazh @vinx13

Thanks for the PR @zackcquic.

  1. Why would you like to keep runtime profiling and pass profiling separate? The benefit I see is that a lot of the code is similar. We could avoid a lot of code duplication. On the other hand runtime profiling has does have a lot of code around handling timing on different devices, which would not be used for pass profiling.

  2. I think we need consistent naming around profiling/instrumentation. I’d prefer names like tvm.pass.profiling and tvm.runtime.profiling.

  3. Reading through your PR, there seems to be two interfaces for adding a new PassInstrument. Either you can subclass PassInstrument or you can register callbacks. I’d like to see a single API. Subclassing PassInstrument is more in line with how we normally handle extensibility in the codebase. It also a better interface if the instrument needs to maintain some internal state.

  4. What instruments do you see being useful in the future? Time and memory usage are the only ones that come to mind for me.

  5. What are parts of the code do you imagine we will instrument/profile in the future? (It might be useful to talk about adding a more general to do instrumentation in the codebase, but maybe that is not appropriate for this discussion).

@areusch May have some feedback too.

To follow up on naming,

My understanding is that instrument goes beyond profiling(e.g. can use to collect the IRs being passed around, dump the IR across pass runs for generate debugging purposes). The proposal is essentially a structured form of tracing.

Because of that reason, instrument/tracing would be a better namespace than profiling. We can discuss the specific naming convention by looking into the convention used by existing frameworks. If the class overload and instrumentation is more common than functional trace callback, we can go with that route, as long as the naming is consistent.

Thanks a lot ! @tkonolige and tqchen.

The proposal of the PR basically comes from that I want to explore more opportunities at compile time.

It’s nice of you to point out the parts I missed, and think the whole picture thoroughly at very beginning.

Naming Discussion

To answer about the naming:

This is the whole picture I’d like to do.

I am not an expert in language, here is what I thought about the three words (instrument, trace, profile):

  • Instrument is like tool, users can implement it as a trace-like tool or a profiling-like tool.
  • Profiling collect statistics.
  • Tracing records a sequence of targets to observe.

How do you think?

Usage Examples

Here are some examples (candidates I plan to do later):

Pass profiler examples Pass tracer examples
Pass transformation time Print IR before/after pass
Pass memory usage Memory access ranges
Memory references before/after pass Which pass eliminates xxx function (debug tool)
Particular Relay/TIR nodes histogram (can be trace)
Runtime profiler examples Runtime tracer examples
Op running time Memory access address
Op memory usage Call/branch trace
Dynamic instructions histogram (can be trace) Hardware provided tracer
Hardware performance counters
Hot blocks
Hot pages

(Pass time profiling and IR printing before/after are standard instruments in both LLVM and MLIR.)

Pass profilers/tracers help to debug passes and explore ways to optimize passes. Runtime profilers/tracers help to debug runtime behavior and explore better ways for code scheduling.

They interest in different domains (e.g. IR nodes vs dynamic instructions), that’s the basic idea I want separate compilation and runtime instruments.

Utilities Sharing

And yes, I agree some utilities can be shared to avoid redundant code.

Like the time profiling in this PR (credit goes to @altanh, l just move it from transform.cc to instrument.cc), @tkonolige 's branch Comparing apache:main...tkonolige:profiler_papi · apache/tvm · GitHub has similar functionalities.

I would like them to share the same interface (separating common and different parts is out of the scope of this PR). For different purposes, they may have different considerations, like:

  • Passes time profiling uses compilation host’s timer and maybe in coarse granularity, together with other profilers/tracers are allowed.
  • Runtime time profiling needs to profile alone, and uses device’s timer with fine granularity.

Same goes to memory usage profiling.

@tkonolige

Yes, maintaining internal state is important.

One way is subclass, and the other way I kept it to handle cases like:

class Debuger():
    def __init__(self):
        self.count = 0

        pi = PassInstrument("Counter")

        @pi.register_run_before_pass
        def run_before_pass(mod, info):
            self.count += 1
            return True

        self.pi = pi

    def get_pi(self):
        return self.pi

    def report():
        #  Render count

How do you think? (I prefer it than subclass, but I kept both.)

Thanks @zackcquic . I also did a pass over the draft PR and I think the overall proposal looks great. It would be good to think a bit about API naming and naming convention in related previous designs.

e.g. how can we choose the argument name to the PassContext constructor

hi @zackcquic , thanks for raising this! I think it’d be great to add some more instrumentation to both the compiler and runtime.

I don’t have too much to add right now about how we instrument the compiler–I think what you’ve said makes sense. But, I do wonder whether it might make sense to adopt a common data representation so that we could use the same utilities to analyze both compiler passes and runtime results. what do you think?

Hi @areusch, thanks for comment.

Yes, I agree that data representation and rendering/analysis mechanism could share.