I was having difficulty reading some of the stack traces in TVM, so I put together a TVM-specific gdb filter to hide stack frames that don’t give significant debugging information, and to give better python-specific information. I’ve been using it for a few weeks now, and wanted to share it as it may be useful to others.
- Any stack frames that correspond to a python stack frame (
PyEval_EvalFrameEx) show the python function name, source file, and line number instead of the C++ stack information. - Any other stack frames coming from CPython are hidden.
- Any stack frames coming from calls through
PackedFuncare hidden.
The filter and installation instructions are available on github.
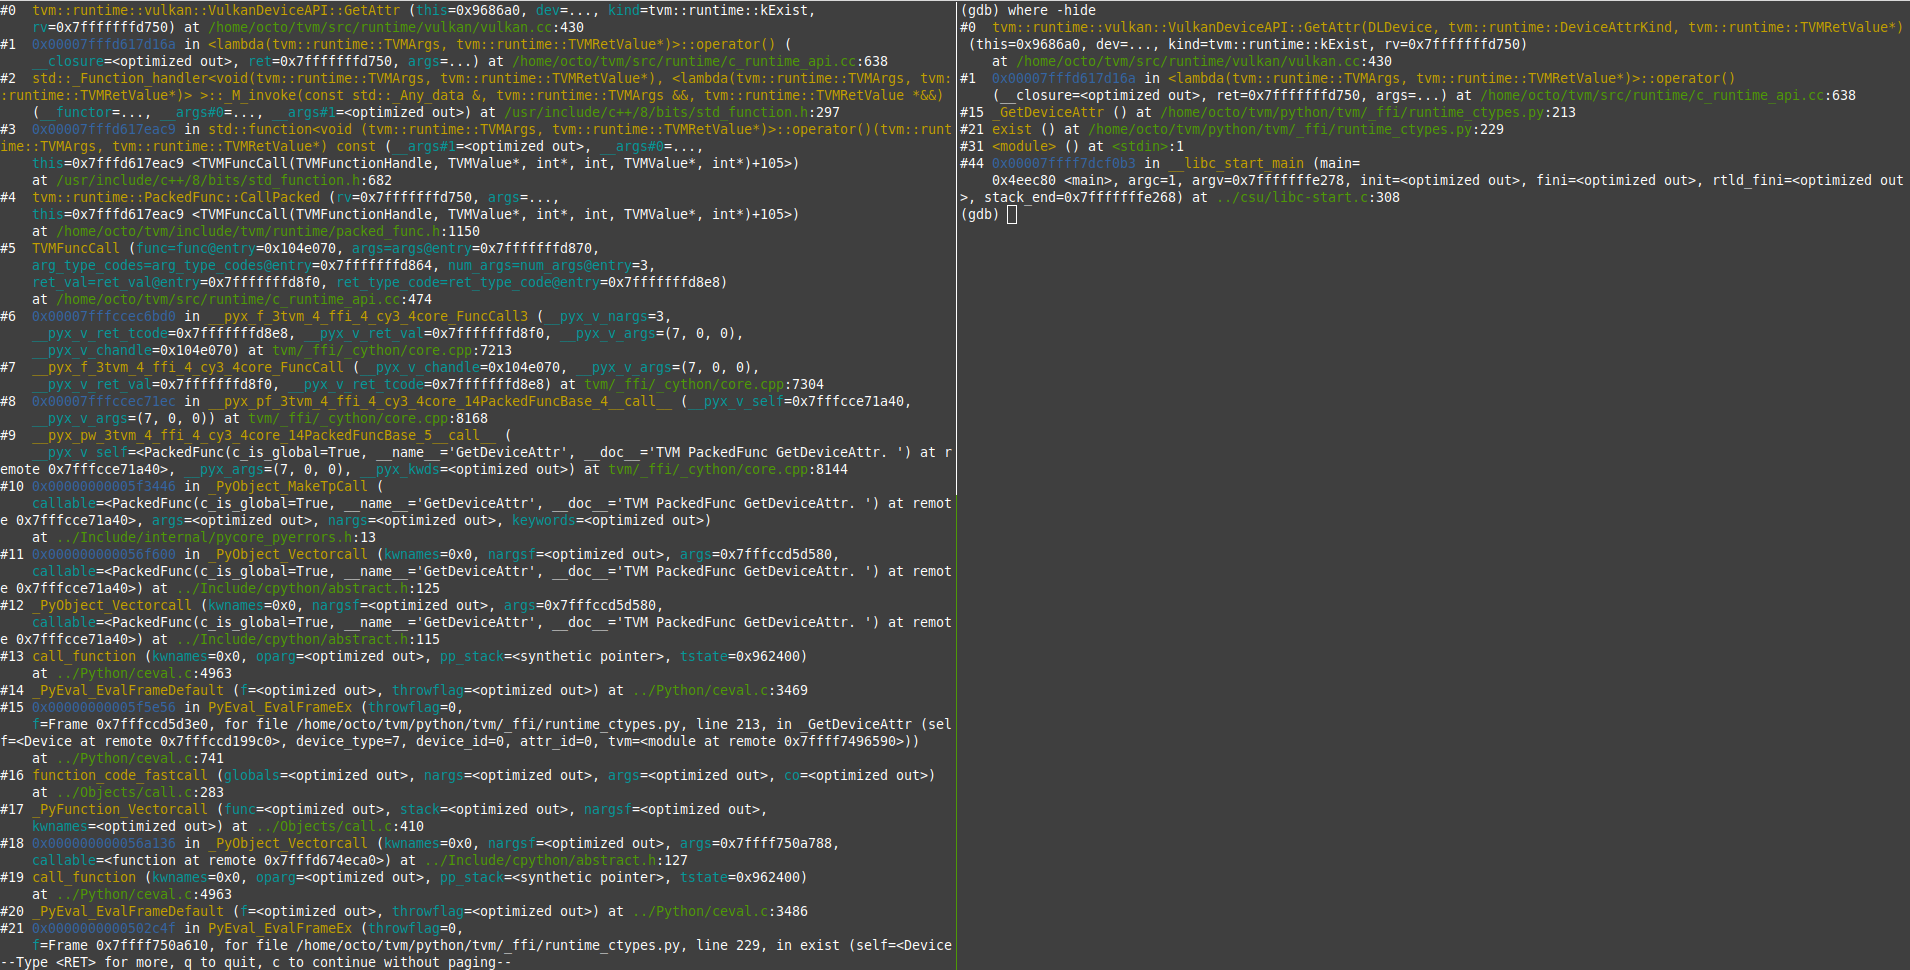
As an example, the left and the right are the same stack trace for the python command tvm.device('vulkan').exist, with a break point at VulkanDeviceAPI::GetAttr, but the right has the cleanup filter applied.