If you like IDE, recommend you try visual studio 2017, but you have to compile tvm in windows with msbuild, and then just create python project, now you can step into tvm runtime lib, just like you debug a normal c++ library
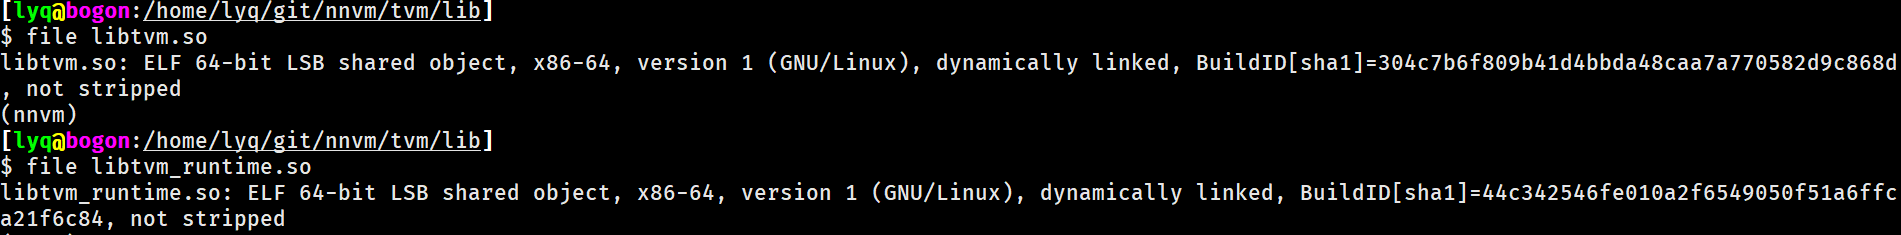
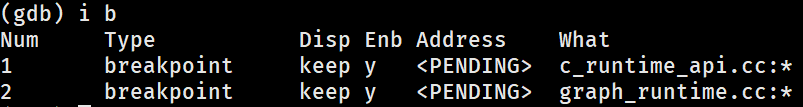
In my experience, starting python under GDB usually causes all kinds of arcane issues. It’s much better to attach GDB to a running python program to avoid that. For example, your issue seems to be that you are setting breakpoints on non-existent address, I’m guessing that you set your breakpoints before tvm related shared libraries are loaded. GDB may or may not fix the symbol address for you.
I would recommend the following extra simple steps:
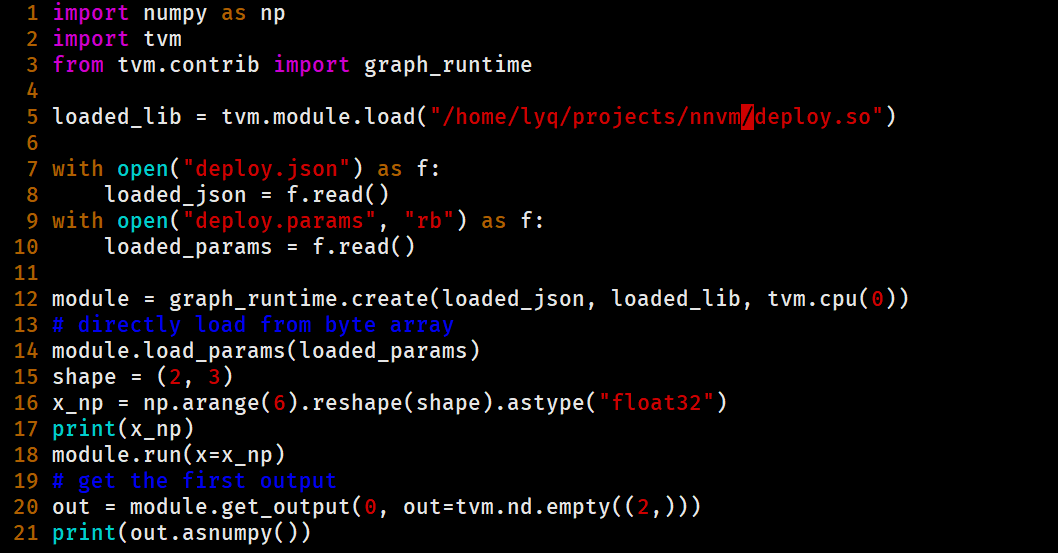
Add input("dummy breakpoint") after the last import statement(from tvm.contrib import graph_runtime). So the program will stop after loading all tvm shared libraries.
In a separate window, find the process id of the python program and attach GDB to the process, set the breakpoints you want and continue the program so GDB won’t pause the python process.
Go back to python program and type anything just to resume the python program and it will hit your breakpoint!
I have build TVM with DEBUG, and I want to step into relay.build_module.build() python function and (my goal) is to step into underlying C++ code form python.
My python project is in PyCharm, and I am lost from here. My goal is to start from python (PyCharm environment) and hit any debug point in C++ code which might be the entry for the relay.build_module.build() python function.