Hi,
I am trying to build an AI-driven performance predictor, which is able to predict the power consumption, memory allocation and inference time of a network based on its Relay description. The final goal is to enable an AI-driven scheduling of inference exeuctions across the targets of heterogeneous or distriubted systems, achieving the most optimal performance. (But it is still is at an early stage, as I am currently struggleing with the following problem)
To do this I am benchmarking and profiling a larger number of random hyperparameter configurations for each relevant layer type and train a regression model for each combination of layer type, performance characteristic and target device.
This seems to be working reasonably well for Fully Connected and Pooling Layers. For Conv2D workloads on CUDA targets, however, I am not able to fit my models to the measurement data.
To investigate I manually profilied very similar hyperparameter configurations and realized that small configuration changes can a huge impact on the performance, which I cannot explain:
One example:
- Input Tensor (NCHW): (1, 3, 225, 225)
- Kernel: 3x3, 32 Output Channels
- Dilation: 1
- Strides: (1, 1)
- Groups: 1
- Padding: 0
- Measured Runtime: 178 µsecs
- Measured Power Consumption: 225 W
- Measured Memory Allocation: 430MB
now, when I add a padding of 1:
- Measured Runtime: 30 µsecs
- Measured Power Consumption: 270 W
- Measured Memory Allocation: 430MB
I am not performing tuning, as it takes too much time and I would like to provide a baseline with the performance prediction. I looked into TOPI and how the CUDA backend selects the schedules/templates, but it looks like, both layer configurations should be executed using topi.cuda.conv2d_nchw.
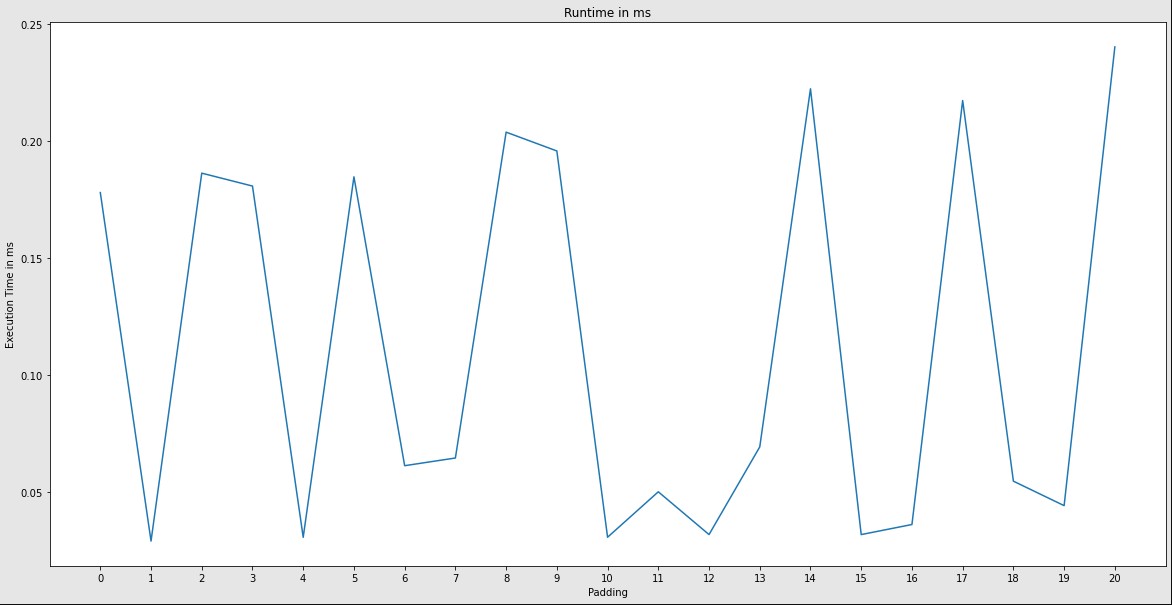
How can this huge difference in execution time be explained?
EDIT: To showcase the inconsistency, I measured the the execution time of the same workload with increasing padding: