Hi everyone, I’m hoping for some guidance on what I might misunderstand.
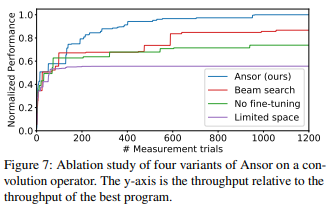
I’m trying to reproduce Fig7 in Ansor paper. The paper says that each curve is the median of 5 runs.
What I did is to set different number of trials ([10, 20, 50, 100, 200, 300, 500, 700, …]) and run the auto_schedule with each number of trial for five times. Then I gathered the results, calculated the median and made a plot.
I found that my curve is rigged compared to the one in the paper, the curve in Ansor’s fig7 is very smooth and monotonic.
I’m wondering whether I misunderstood anything, one of my guess is: fig7 is a only a single experiment with n_measure_trials=1000, then plot the best schedule at trial 50, trial 100 and so on.
Which way is the right way to reproduce the fig7?
Thanks!
It is got by 5 runs with n_trials =1000. The order of applying median and max makes it smooth and monotonic.
I can make an example with n-trials = 10 and 3 runs.
import numpy as np

# Raw measurement data
run1 = [0.1, 0.2, 0.2, 0.4, 0.2, 0.4, 0.1, 0.8, 0.8, 0.9]
run2 = [0.1, 0.2, 0.1, 0.5, 0.6, 0.4, 0.1, 0.9, 0.8, 0.4]
run3 = [0.2, 0.1, 0.3, 0.6, 0.9, 0.4, 0.9, 0.7, 0.2, 0.9]

data = np.vstack([run1, run2, run3])

# Get median across 3 runs
median = np.median(data, axis=0)

# Get the max throughput from trial 0 to trial i
max_curve = []
for i in range(len(run1)):
    max_curve.append(np.max(median[0:i+1]))

# A smooth and monotonic curve
print(max_curve)
Thank you so much for the answer.
So for each run, I need to export the schedule at certain trials (e.g. export the schedule when number_of_trials=100), then resume the search until next number_of_trials I want.
All measurement data is written to the log file.
For example, if n-trials = 1000, the log file will have 1000 lines. Each line contains the execution time of one measured schedule. You do not need to run the measurement again by yourself. You can get the execution time of 1000 schedules from the log file.
You can use this function https://github.com/apache/tvm/blob/0095b21e01fa40f60286d8596e25beb57b929b7a/python/tvm/auto_scheduler/measure_record.py#L64 to read the log file and do analysis.