Ansor tuning issue on Mali?

I’m tuning a conv2d workload on Mate30 android phone with Mali G76MP16, below is the compute_dag

========== Task 5 (workload key: ["65de44bf533ab9836cbbb4ede45ac081", 1, 348, 12, 12, 2084, 348, 1, 1, 1, 2084, 1, 1, 1, 2084, 12, 12]) ==========

placeholder = PLACEHOLDER [1, 348, 12, 12]

PadInput(i0, i1, i2, i3) = placeholder[i0, i1, i2, i3]

data_vec(n, h, w, ci, vh, vw) = PadInput[n, ci, ((h*4) + vh), (w + vw)]

placeholder = PLACEHOLDER [2084, 348, 1, 1]

kernel_vec(co, ci, kh, kw, vc) = placeholder[((co*4) + vc), ci, kh, kw]

conv(n, co, h, w, vh, vw, vc) += (data_vec[n, h, w, ci, (vh + kh), (vw + kw)]*kernel_vec[co, ci, kh, kw, vc])

output_unpack(n, co, h, w) = conv[n, floordiv(co, 4), floordiv(h, 4), w, floormod(h, 4), 0, floormod(co, 4)]

placeholder = PLACEHOLDER [1, 2084, 1, 1]

T_add(ax0, ax1, ax2, ax3) = (output_unpack[ax0, ax1, ax2, ax3] + placeholder[ax0, ax1, 0, 0])

T_sigmoid(ax0, ax1, ax2, ax3) = tir.sigmoid(T_add[ax0, ax1, ax2, ax3])

T_multiply(ax0, ax1, ax2, ax3) = (T_add[ax0, ax1, ax2, ax3]*T_sigmoid[ax0, ax1, ax2, ax3])

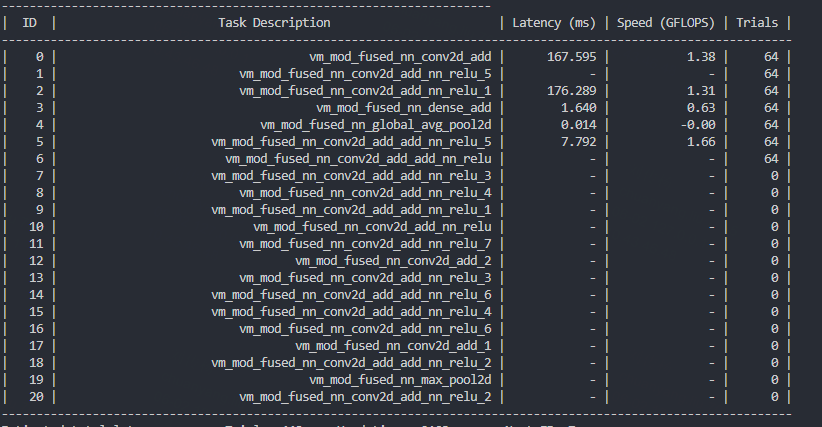
The tuning however yielded impossible perf numbers

----------------------------------------------------------------------
|  ID  | Latency (ms) | Speed (GFLOPS) | Trials |
-------------------------------------------------
......
|    5 |        0.029 |        7122.14 |     64 |

Only happens on newer Mali models. P30 with Mali G76 MP10 did not encounter such error, but Mate30 with G76 MP16 and Mate40 with G78MP24 both have similar issues.

Thoughts?

Could you be more specific about why the performance number is impossible? Is it too fast? And did you verify the correctness of the Ansor-generated schedule against the default one?

Yeah 7 TFLOPS on Mail sounds too off. Maybe tuning is happening on the local GPU?

Yes I believe the peak of G76MP16 is somewhere around 700GFlops for FP32. The other GFlop numbers in the table seems normal. Kernel run and measurement seems to be happening on the android device.

I haven’t looked into the correctness of generated schedule, but it seems compilation would crash when applying such Ansor logs.

I have seen similar behavior running AutoTVM on Vulkan backend on AMD APUs. Essentially seeing impossible numbers that are way above the theoretical capabilities of the hardware. Digging into the logs I essentially saw kernels that ran orders of magnitude faster than the rest of the kernels for a given autoTVM task. I suspect that the issue here is that there is a runtime error triggering on the RPC server right at the beginning of the kernel executing, and fails to be caught as an error.

1 Like

It’s interesting that you’re getting this on the Mali backend too - I assume you’re using OpenCL or are you using Vulkan?

Thanks for your input. Yes it was OpenCL.

That’s interesting. If the schedule causes the compilation error, then it shouldn’t even have a valid latency as shown in the log. Maybe you could add some logs in the Ansor RPC to see if we could find some clues.

cc @FrozenGene who had some experience in running auto-scheduler on mali GPUs.

If we meet the performance beyond theoretical, one potential problem is we generate wrong code. For example, when we apply it, we will get wrong result (like all zeros or what else). So could you verify the output and correctness? Even we could extract and construct single layer you have problem and apply the ansor log to simplify this issue.

@merrymercy @comaniac @FrozenGene

I am tuning a resnet model on MALI G76 with opencl. But some layers without Latency adn Speed information: